Il modulo Dashboards & Reports è una piattaforma analitica complessa con report pronti all'uso. Più di una dozzina di report per analizzare la produzione, la qualità, le tendenze e gli obiettivi e ottenere vari approfondimenti sulla produzione. I report possono essere visualizzati dal punto di vista dell'impianto, della macchina e in diversi intervalli di tempo.
Come analizzare il processo di produzione?
La fretta quotidiana rende difficile fermarsi, creare rapporti e confronti sulla produzione. I cruscotti e i report di Accevo consentono di vedere facilmente la fabbrica da diverse prospettive e di comprendere rapidamente tendenze e problemi. Controllate le prestazioni, la disponibilità e la qualità rispetto a specifici ordini di produzione, divisioni di impianti o macchine.

Come verificare il motivo per cui non si è rispettata la scadenza di produzione?
La cascata OEE è uno strumento potente che vi darà rapidamente la risposta alle principali ragioni per cui il vostro piano di produzione non viene rispettato. Controllate le gocce OEE definite in base al vostro glossario e fate un'analisi approfondita per trovare le cause principali.

Caratteristiche principali
Rapporti vari per la produzione, le macchine, la qualità
Dashboard per la produzione in corso
Un'angolazione diversa per l'analisi dei dati
Vantaggi principali
Generazione automatica e rapida di rapporti
Accesso rapido a dati aggregati e dettagliati
Esportazione dei dati in Excel per la creazione di report personalizzati
Cosa si può monitorare
Il sistema presenta i rapporti di produzione:
- Riepilogo turno, giorno, settimana, mese: produzione buona e difettosa, OEE
- Prestazioni della macchina: produzione buona e difettosa
- Realizzazione dell'obiettivo di produzione
- Numero e durata dei guasti, delle interruzioni e dei microarresti
- Calcolo del tempo di ciclo reale dell'articolo per le operazioni
- Presentazione grafica degli ordini di produzione realizzati sulle macchine
- Macchine a confronto per tempo di lavoro, tempo di sosta, OEE
- Report sugli ordini di produzione e sulle operazioni: stati (ordini pianificati, ordini iniziati, ordini finiti, ordini in ritardo) e stato di avanzamento
Il sistema presenta rapporti sui dati delle macchine:
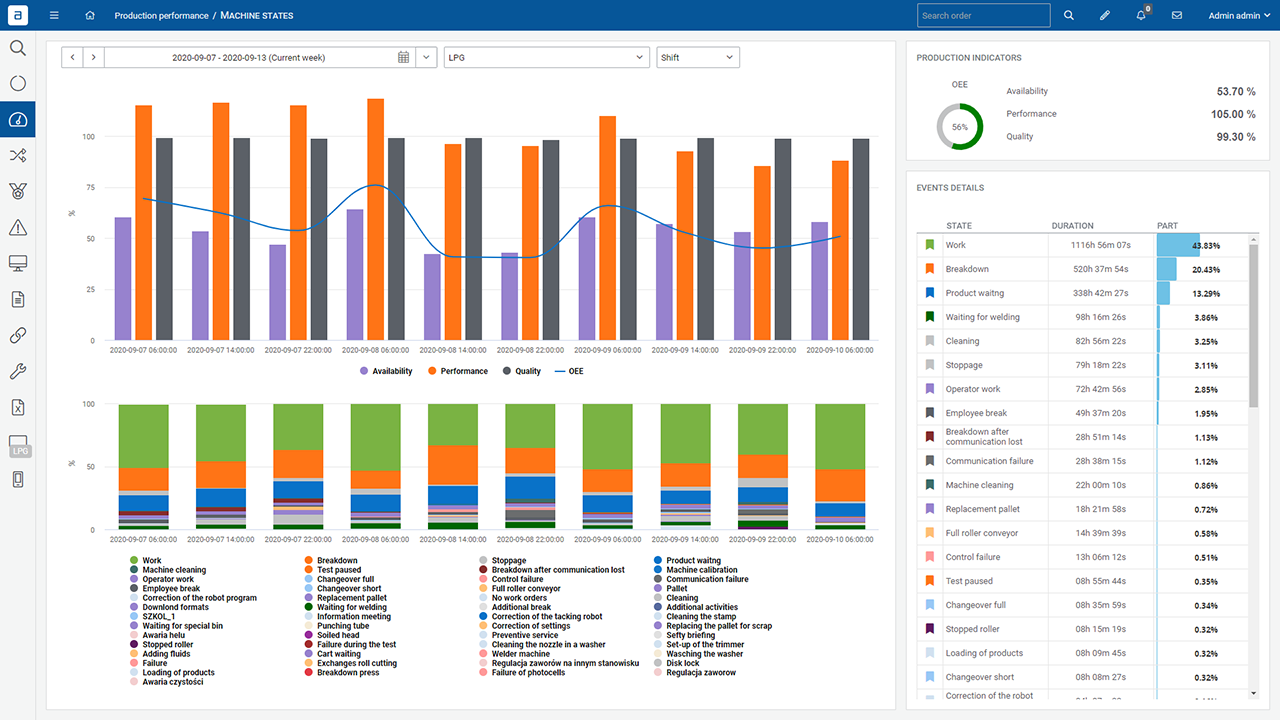
- Le macchine dichiarano il tempo: lavoro, microfermate, guasti, rotture
- % quota di stati macchina
- % quota del motivo di arresto della macchina
Il sistema presenta rapporti sulla qualità:
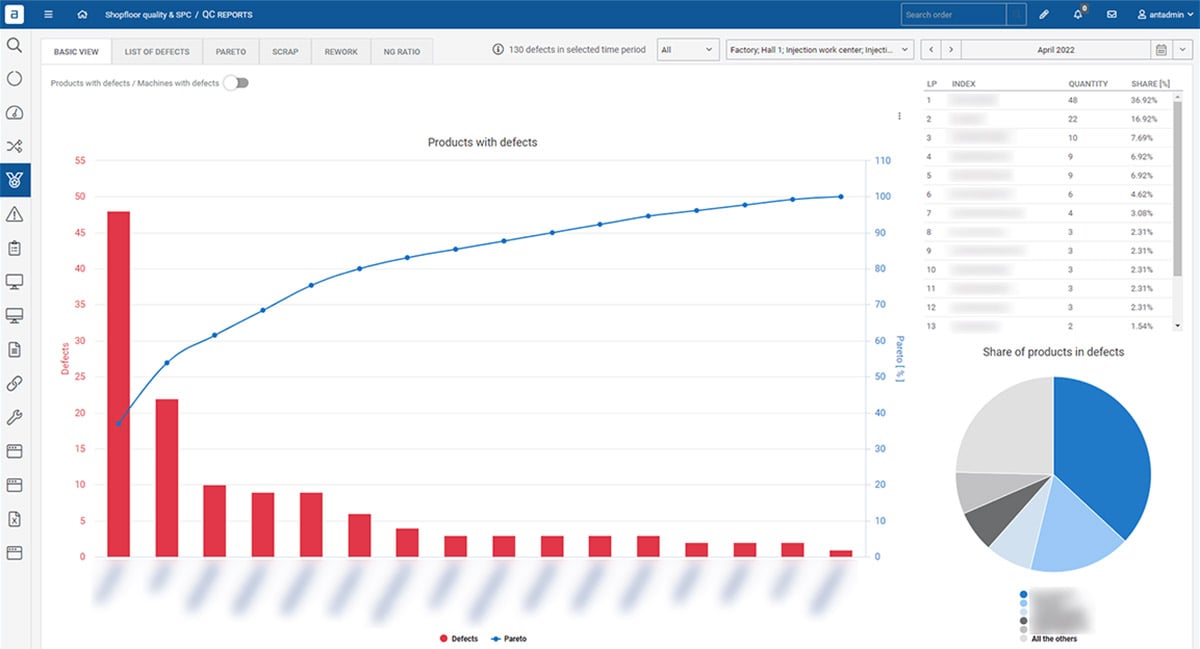
- Difetti Pareto per articoli e tipi di difetti
- Quantità di difetti, scarti e rilavorazioni per un intervallo di tempo selezionato
- La maggior parte delle macchine e degli articoli difettosi
Inoltre, il sistema presenta grafici di tendenza con OEE, disponibilità, prestazioni, qualità, quantità di produzione, stato principale della macchina, numero e tempo per cambi e guasti, MTBF/MTTF/MTTR.
Articoli correlati

Come rendere più efficienti le riunioni in fabbrica?
Le riunioni in officina sono praticamente quotidiane e sono essenziali per far funzionare le cose in modo efficiente ed efficace. Il tipo e la quantità di

Come monitorare efficacemente l'andamento della produzione in tempo reale?
Il monitoraggio dei cambiamenti nella produzione - avanzamento, tempi di consegna, possibili fonti di ritardo - svolge un ruolo particolarmente importante nell'industria. Consegnare i prodotti

Come monitorare e controllare una linea di produzione di assemblaggio automatizzata?
Con l'avvento dell'Industria 4.0, l'automazione in senso lato delle linee di produzione è diventata uno standard, senza il quale è difficile immaginare un moderno sistema di produzione.

